Participants would begin by completing a short monthly survey that captures scaled emotional inputs alongside optional written reflections. Responses would be securely aggregated to identify recurring emotional patterns across the group. This dataset would then be fed into a custom generative code system that controls visual variables such as density, color distribution, spatial clustering, and typographic presence, producing the base computational composition. I would subsequently apply a hand-drawn sketched layer to each image to reintroduce human gesture into the output. The finished print would integrate selected anonymized participant quotes and would be mailed to each participant along with a brief collective summary.
See process below.

To better visualize how this speculative project would function, I created a low-fidelity prototype of the full pipeline. Instead of using a custom website to collect responses, I distributed a Google Form to family and friends, asking them to anonymously answer a set of sample emotional questions.
After receiving the responses, I organized the data in Google Sheets to identify patterns (for example, how many participants reported feeling calm). I assigned each response category a corresponding color and numerical value to prepare the dataset for visualization.
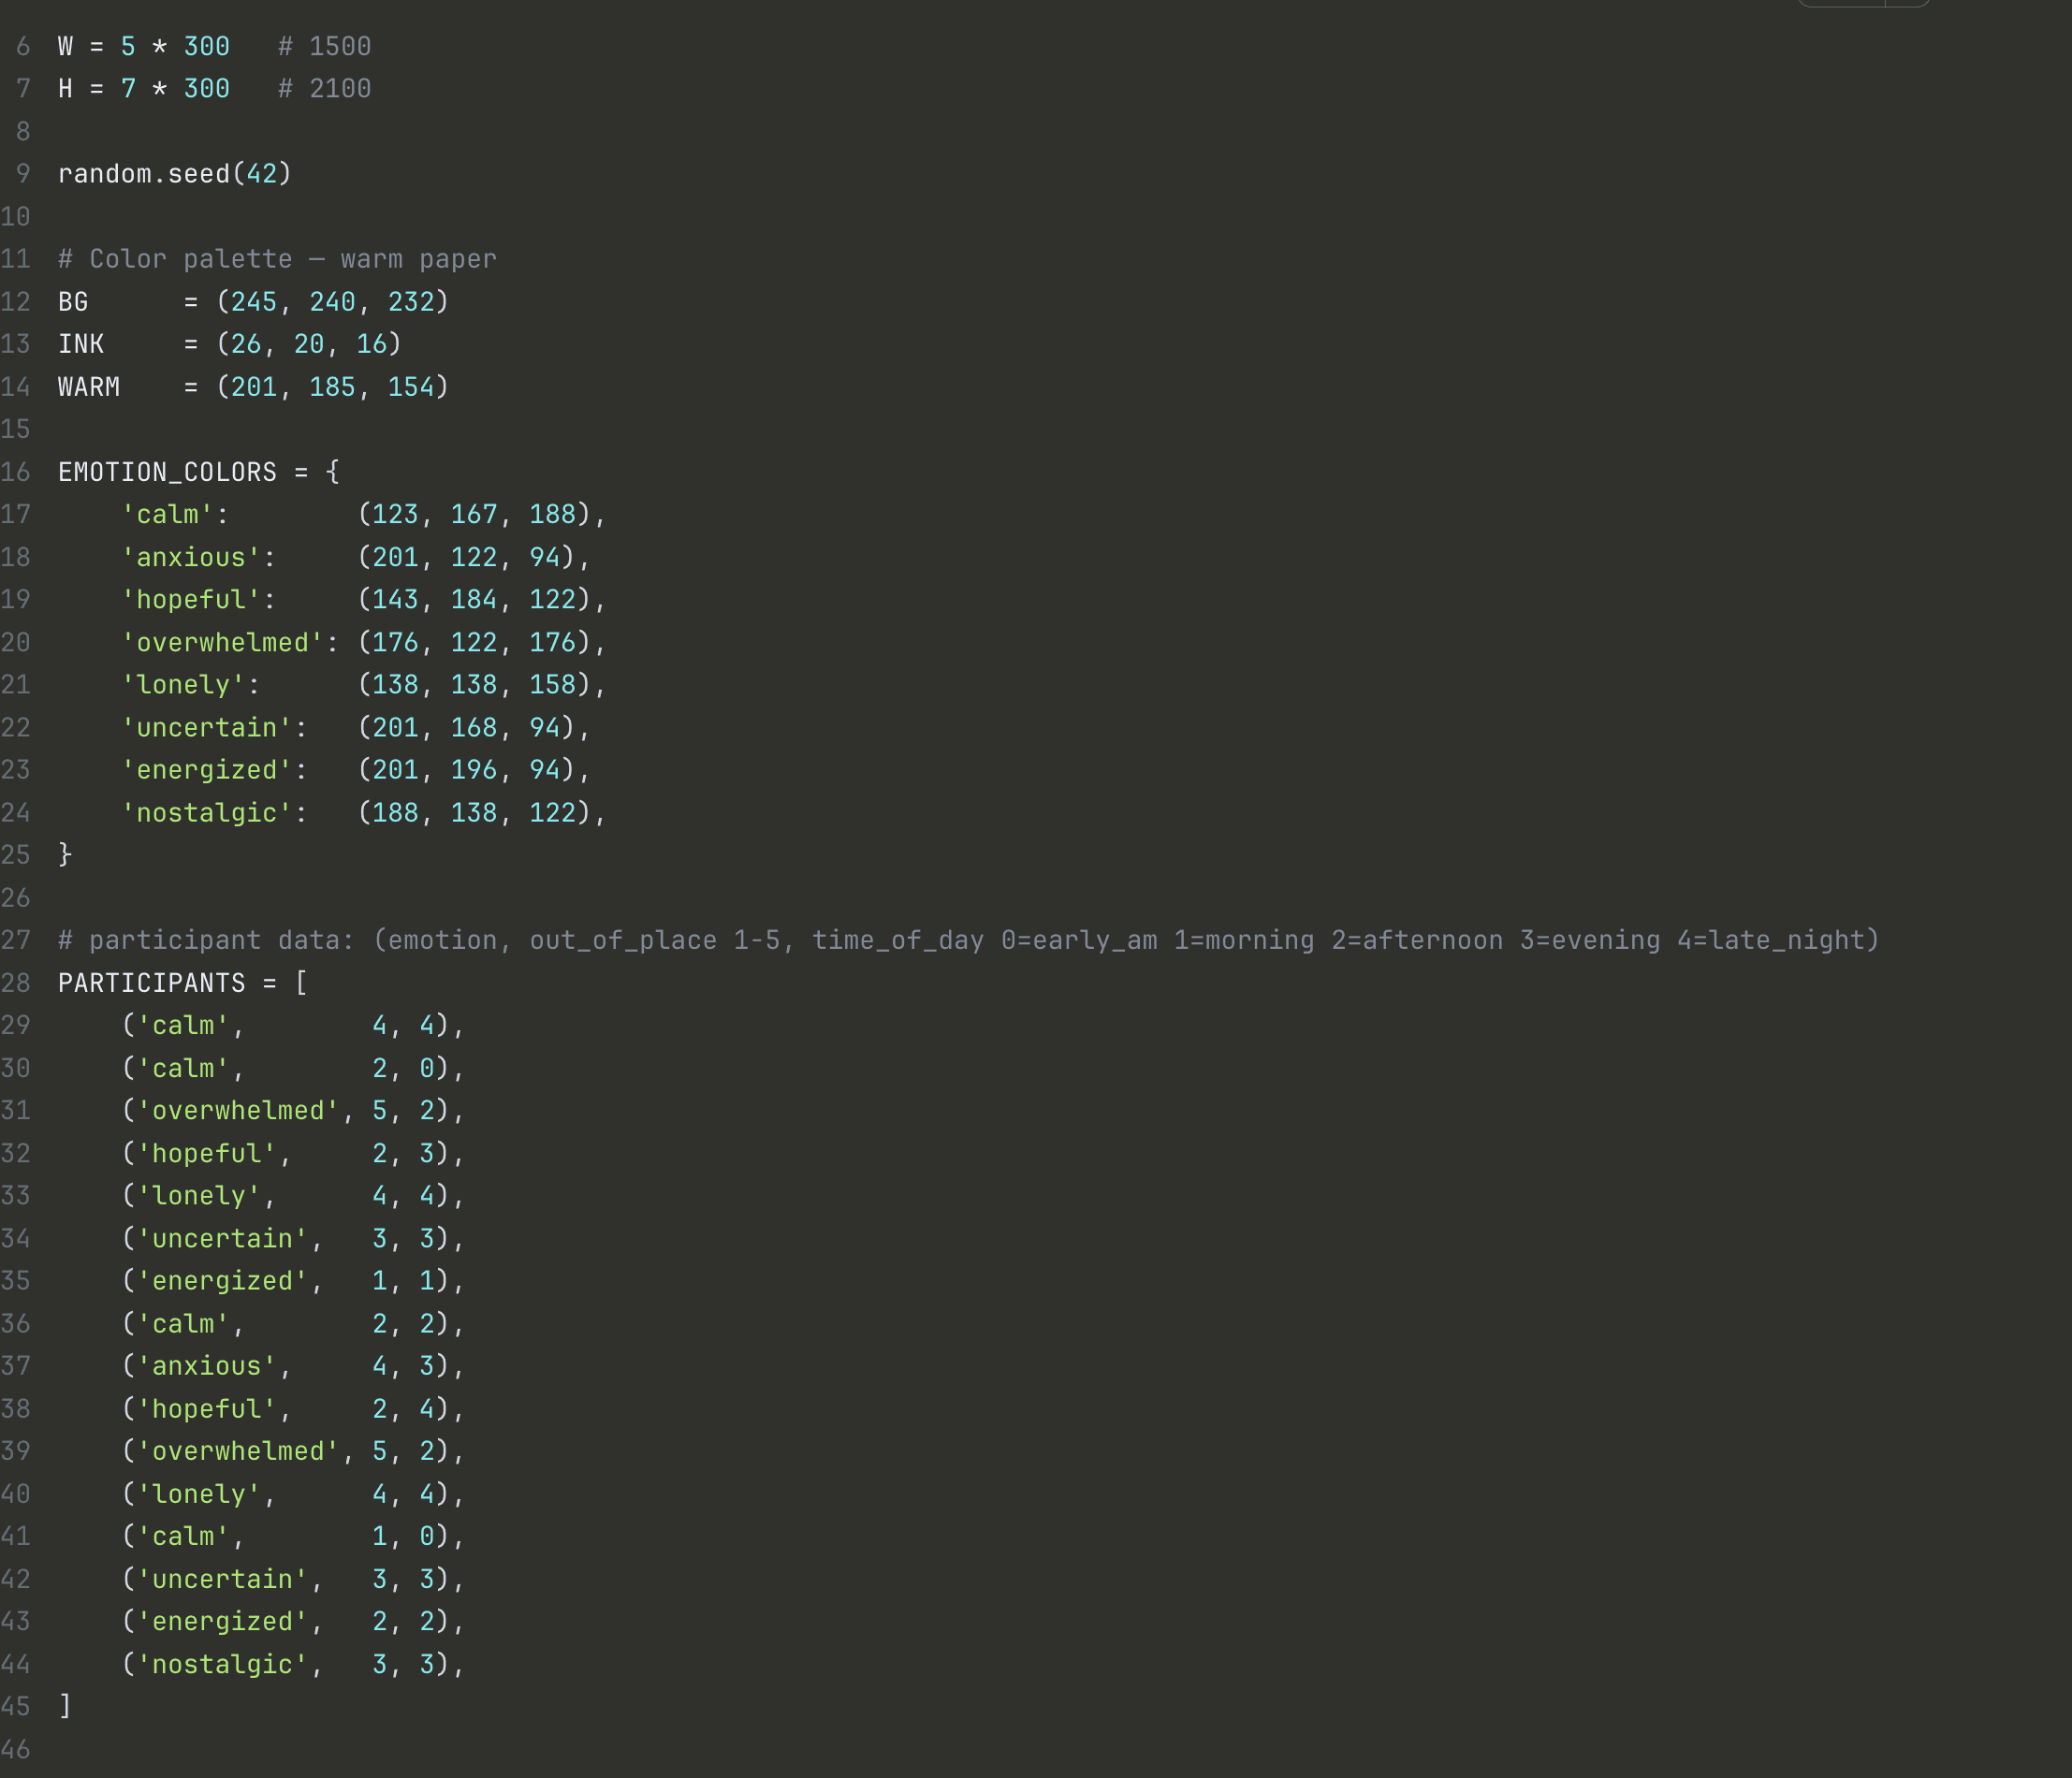
Using this structured data, I wrote custom code that translated the emotional inputs into a generative visual output. The system uses adjustable variables — including density and color — so the visual logic can scale and be reused across monthly cycles. After running the code in an HTML viewer, I exported the generated composition and refined it in Adobe Illustrator to align with the thematic direction of the month.
Below, I included process documentation showing the Google Form, Google Sheet, and code environment. In the next section you will see how this code, and hand-drawn component, creates a final product ready to print and mail to participants.


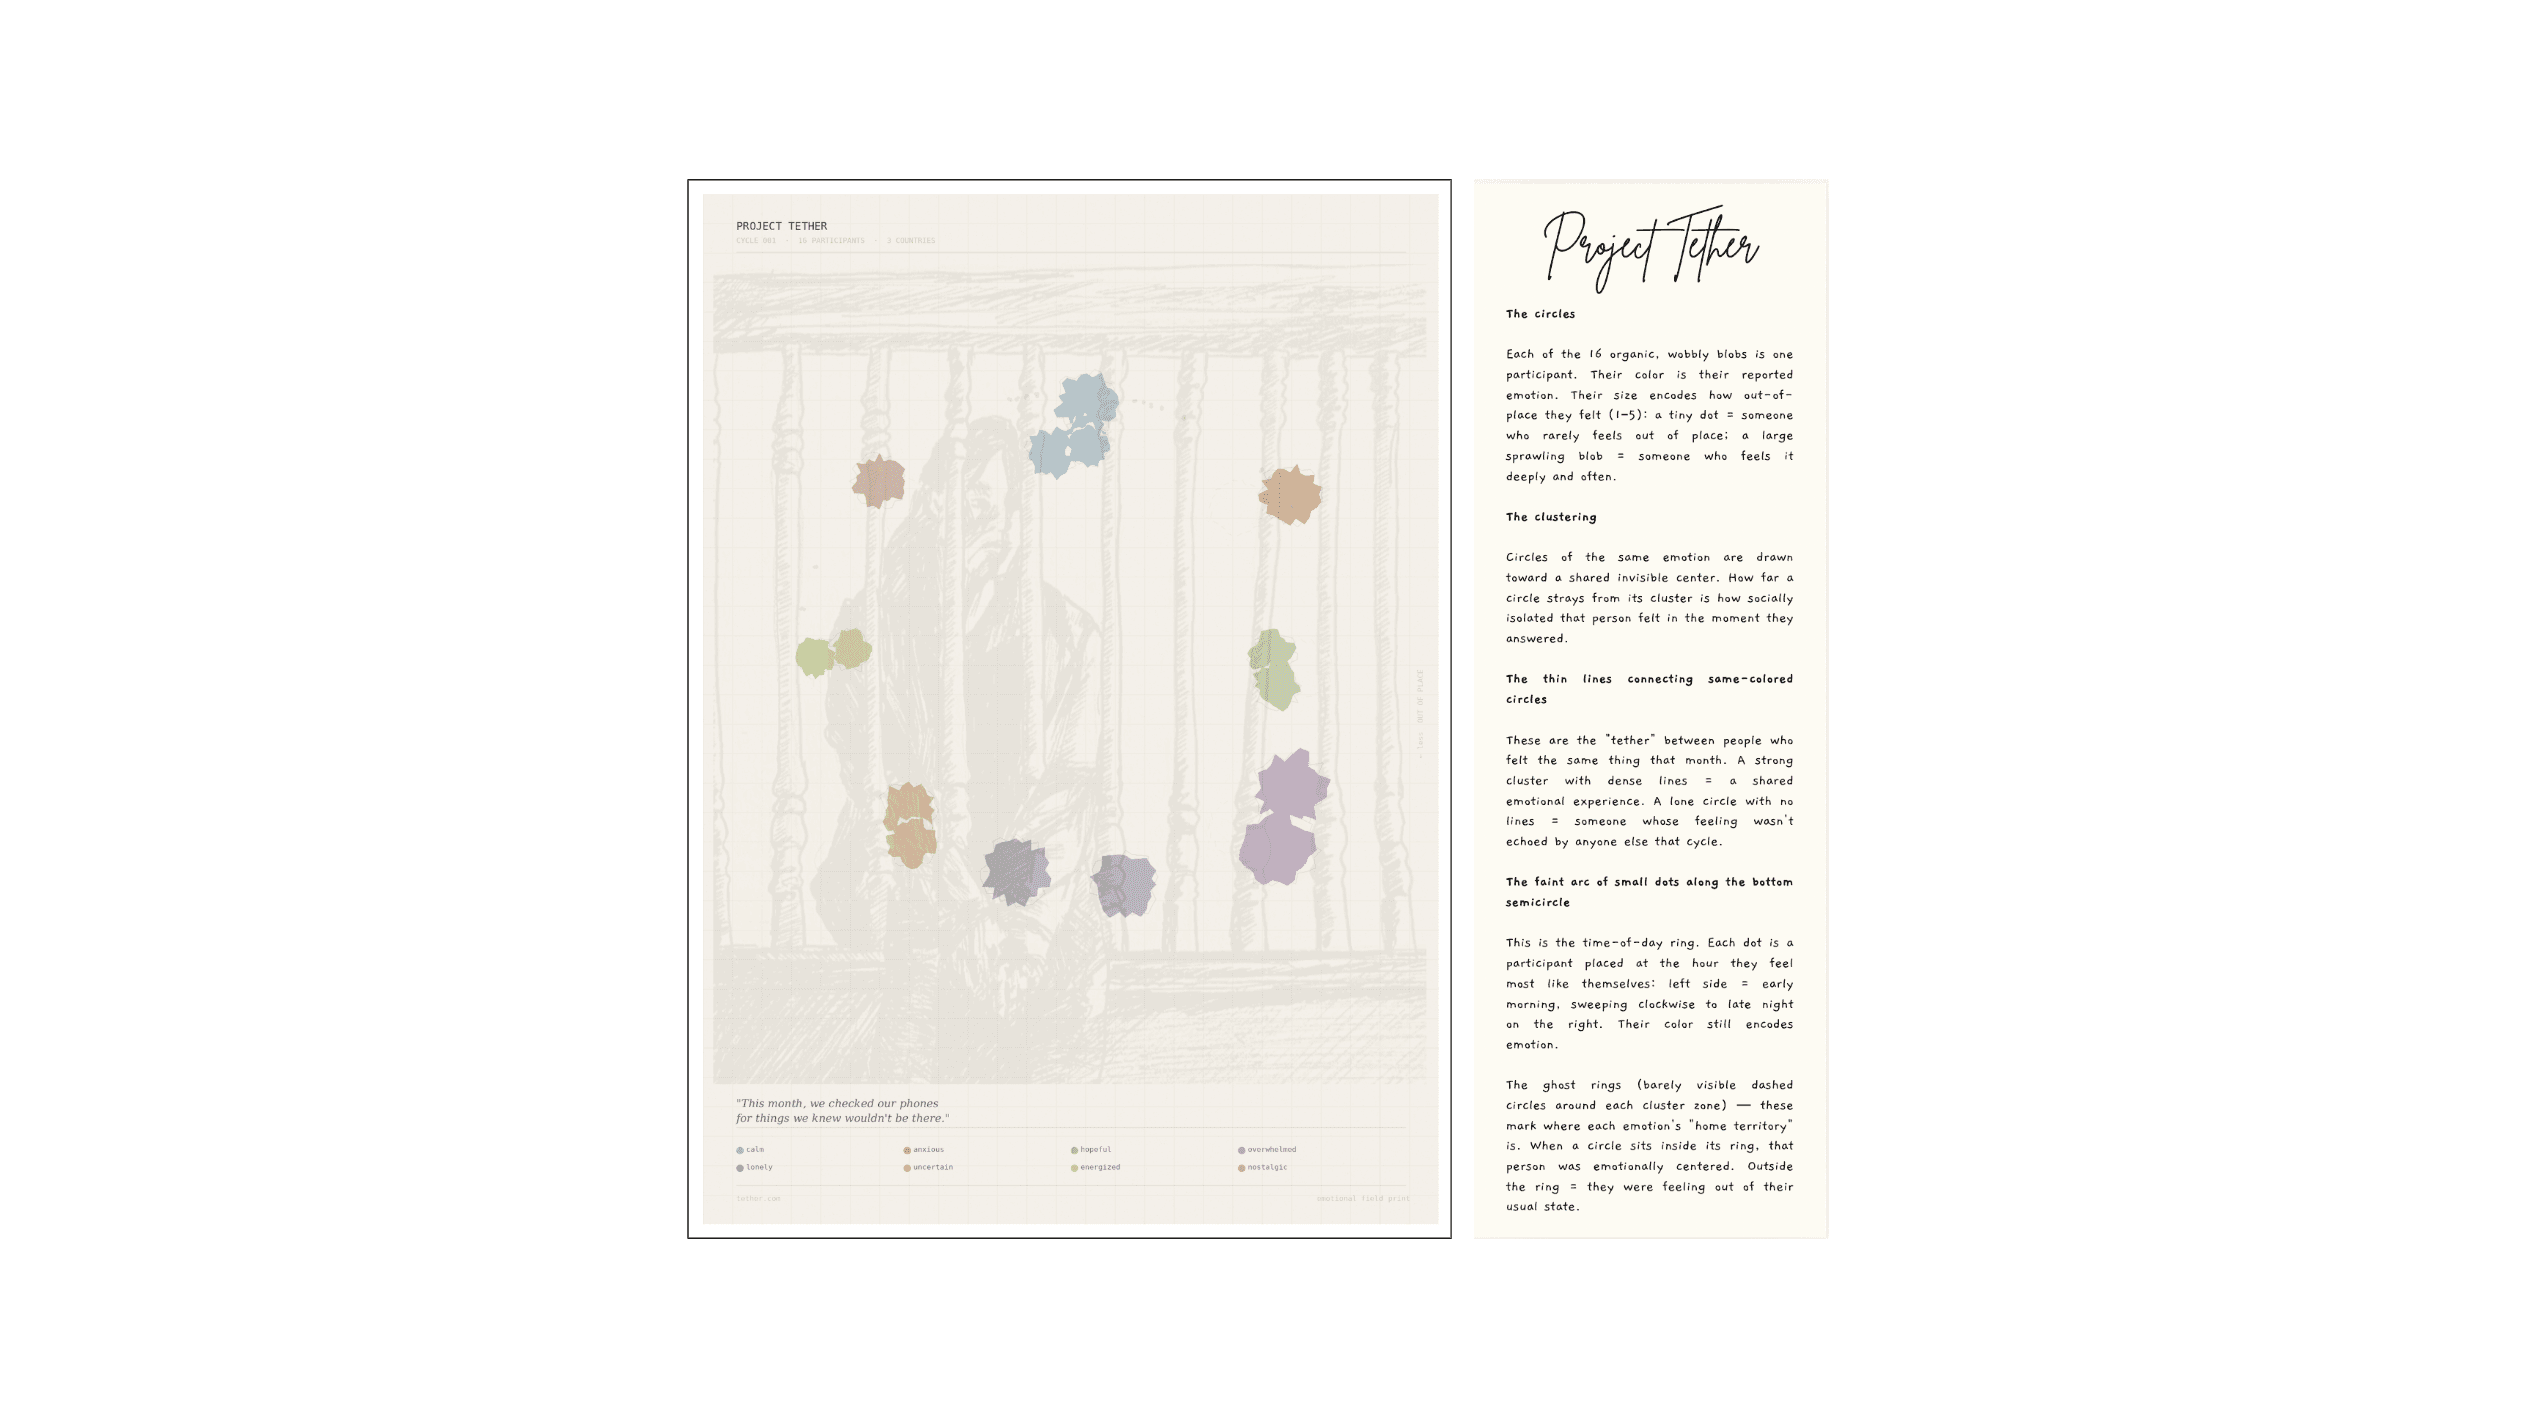
This print combines output produced through written code with a hand-drawn layer that responds to the themes of that month’s submissions. Each participant receives the print along with an accompanying card in the mail, both of which are shown digitally below.
In addition, the tether.com website will feature a video-based digital representation of the monthly print, demonstrated through the GIF in the third image.


